Ecommerce_Data_Anaysis_project
SQL Project: E-Commerce Sales and Customer Insights Analysis
Description
This project uses SQL to analyze the dataset of an e-commerce platform. The goal is to extract meaningful insights about customer behavior, product performance, seller activity, and order fulfillment. By answering critical business questions, this project helps in driving better decisions to optimize e-commerce operations.
Installation
To run this project on your machine, follow these steps using SQL Server Management Studio (SSMS):
- Install SQL Server and SSMS.
- Create a new database.
- Create tables using the schema provided below.
- Import the CSV files provided in the dataset folder into the respective tables. Note: If you are using SQL Server, you can also script out the database for easier setup and restore the provided database backup if available.
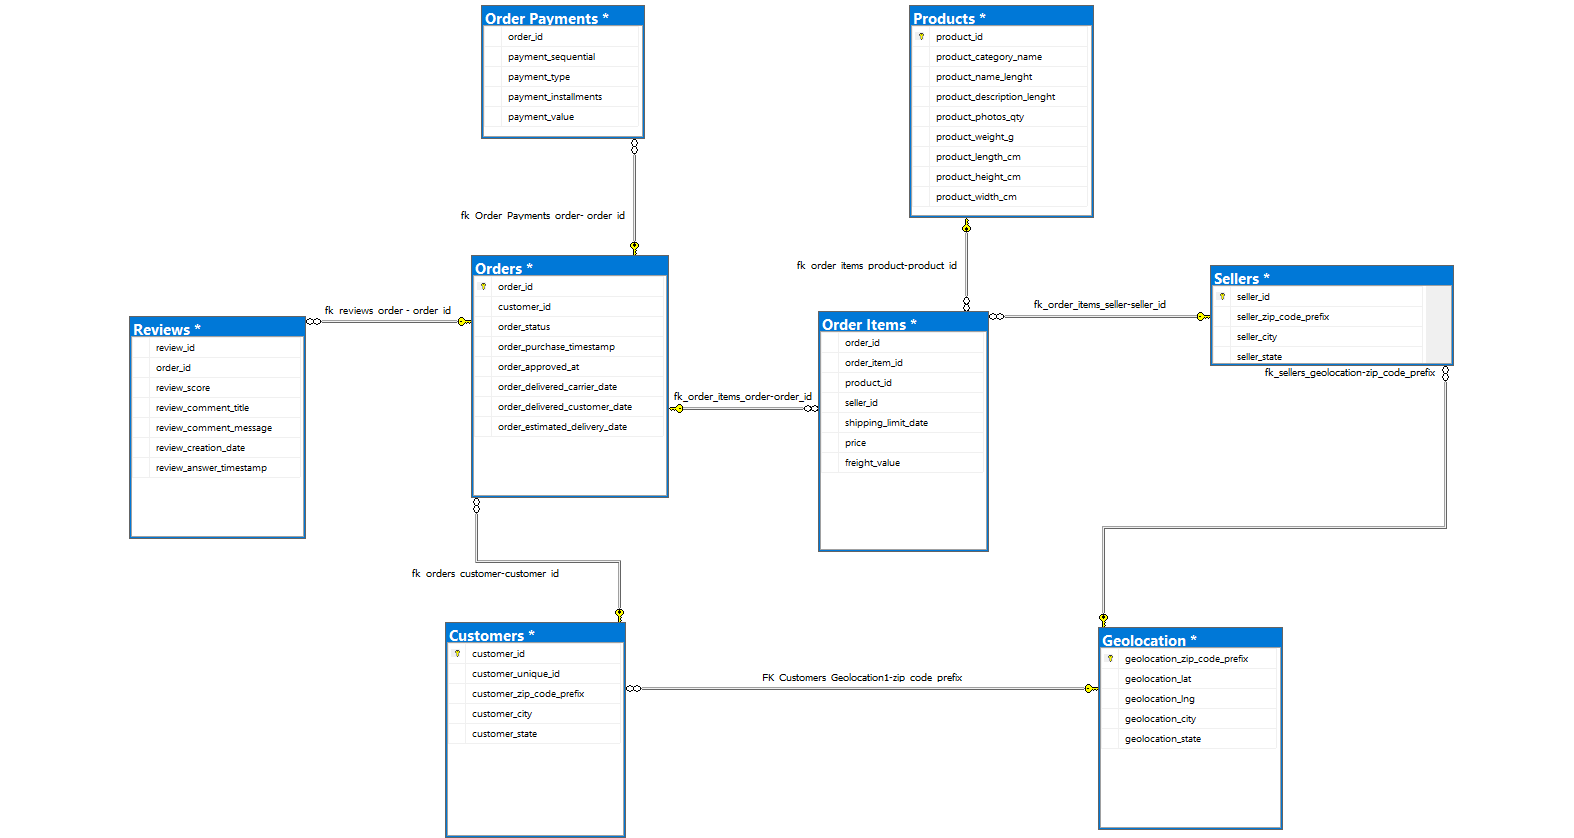
Schema Diagram
Schema Diagram Image Here
Database and Tools
- SQL Server
- SQL Server Management Studio (SSMS)
Credits
This project was developed using publicly available e-commerce data and inspiration from various SQL analysis tutorials and guides.
License
You are free to use this dataset to build your own project and practice SQL skills.
Questions Answered
The following are a few of the questions that are answered in this project.
(check out the full SQL queries in the detailed article here):
- What are the unique states where sellers are located
- How many orders were shipped in 2019?
- Find the total sales amount for each product category
- Calculate the percentage of orders delivered on weekends
- Count the number of orders placed by customers from each city
- List of all orders with customer details and order status
- List of all products sold by a particular seller
- Total sales revenue by payment type
- Average review score per product
- Top 5 best-selling products
- Total number of orders by geolocation (city)
- Revenue breakdown by seller
- Percentage of orders delivered on time vs. late
- Calculate the number of orders per quarter in 2017
- Find the average number of items per order for each seller
- Calculate the percentage contribution to total revenue by each payment method
- Find the top 10 most sold products based on quantity
- Calculate the total revenue generated by each seller, and rank them by revenue
- Find the product category with the highest revenue contribution each month
- Identify products with a higher-than-average selling price in their respective category
- Find the average Review Score by Payment Type
Results
1. Unique States Where Sellers Are Located:
- Sellers are located across multiple states, with unique states identified as PE, PB, PA, RS, AC, BA, SP, and SC.
2. Count of Orders Shipped in 2018
- In the year 2018, a total of 54,011 orders were shipped, indicating a significant volume of transactions processed on the platform.
3. Total Sales Amount by Product Category
- The total sales amount varies by product category, with some categories like PERFUMARIA and AUTOMOTIVO generating substantial sales at 506,738.66 and 852,294.33, respectively. Other categories such as PCS and TELEFONIA also contributed significantly to overall revenue, reflecting the diverse range of products on the platform.
4. Percentage of Orders Delivered on Weekends
- Approximately 6.71% of the orders were delivered on weekends, providing insight into delivery trends and customer demand for weekend deliveries.
5. Count of Orders Placed by Customers from Each City
- The city with the highest number of orders is Sao Paulo with 15,540 orders, followed by Rio de Janeiro with 6,882 orders. Other cities, like Belo Horizonte, Brasilia, and Curitiba, also contribute significantly to the order volume, indicating high customer engagement in these locations.
6. List of All Orders with Customer Details and Order Status
- This query provides a detailed list of orders, showing information like order ID, order status, customer ID, and customer city. Each row represents an order, and all orders in this result have been successfully delivered, as indicated by the “delivered” status.
7. List of All Products Sold by a Specific Seller
- For the seller with ID ‘1464afc72f696af775557a821c2e253f’, this query shows a list of products sold along with their categories and prices. The products mainly belong to categories like beleza_saude and perfumaria, with prices ranging around 28.99 to 42.90, highlighting the seller’s product offerings in beauty and personal care categories.
8. Total Sales Revenue by Payment Type
- This query shows the total revenue generated by each payment type. Credit card payments lead significantly, contributing over 125 million, followed by boleto and voucher. This breakdown helps in understanding customer preferences for payment methods.
9. Average Review Score per Product Category
- The results display the average review score for each product category, with all listed categories receiving an average score of 4. This insight suggests a generally high level of customer satisfaction across these categories.
10. Top 5 Best-Selling Products
- Among product categories, cama_mesa_banho (bed, table, and bath) leads with 11,115 units sold, followed by beleza_saude (beauty and health) and esporte_lazer (sports and leisure). These are the top-selling categories, indicating strong customer demand in these segments.
11. Total Number of Orders by Geolocation (City)
- Sao Paulo ranks highest in terms of total orders with over 4.2 million, followed by Rio de Janeiro and Brasilia. This query helps in identifying high-demand cities, which could be beneficial for logistics planning and marketing efforts.
12. Revenue Breakdown by Seller
- This query return the total revenue generated by each seller, ranked in descending order. It would help assess each seller’s contribution to overall revenue, useful for identifying top-performing sellers.
13. Percentage of Orders Delivered On Time vs. Late
- This query shows what percentage of orders were delivered on time versus late. Only about 1.3% of orders were on time, while 98.5% were late, suggesting most deliveries didn’t meet the expected time.
14. Number of Orders per Quarter in 2017
- This query counts orders by quarter in 2017. Orders gradually increased, with the most in the fourth quarter, likely due to holiday shopping.
15. Average Number of Items per Order for Each Seller
- This query finds the average number of items in each order per seller. Most sellers have an average of one item per order, meaning customers often buy one item at a time from each seller.
16. Revenue by Payment Type
- This query calculates the percentage each payment type (like credit card, boleto, etc.) contributes to the total revenue. Credit cards make up the highest share, contributing 78.34% of the revenue.
17. Top 10 Most Sold Products
- This query lists the top 10 product categories based on the total quantity sold. The “cama_mesa_banho” category is the most sold, with a total quantity of 13,665 items.
18. Total Revenue by Seller
- This query calculates the total revenue for each seller and ranks them from highest to lowest. The seller with the ID “7c67e1448b00f6e969d365cea6b010ab” generated the most revenue, reaching 507,166.
19. Monthly Top Revenue Product Category
- This query identifies the product category that generated the most revenue for each month. By using the RANK() function, it ranks categories by revenue within each month to find the top earner for that period.
20. Higher-than-Average Price Products
- This query finds products that are priced above the average for their category. It first calculates the average price for each category in a temporary table (CTE) and then filters products with a price higher than their category’s average.
21. Average Review Score by Payment Type
- This query calculates the average review score for each payment type. By joining payment and review data, it groups by payment type and sorts the results to show which payment types have the highest average review scores.